How do previous recessions compare with each other? It’s a philosophical question with an enduring resonance.
The first graph below shows trailing EPS for the MSCI World over the past 50 years. The general direction is up, with earnings growing at a compound 6% pa over the period.
However, there have been significant setbacks along the way, usually coinciding with major global economic slowdowns. The average earnings fall was 31%, with the biggest starting in 2007 when MSCI World EPS fell by 61%. The longest recession began in 1989, after which earnings took 4 years to fall 35%.
|
MSCI World Return on Equity For Past Recessions |
|
|
|
|
|
© 2022 Citigroup Inc. No redistribution without Citigroup’s written permission. |
© 2022 Citigroup Inc. No redistribution without Citigroup’s written permission. |
|
Source: Citi Research, DataStream |
Source: Citi Research, DataStream |
The second chart above shows the MSCI World Return on Equity (RoE) is currently at the 16% peak last seen before the financial crisis. The long-run average is 12%, with lows of 8% or below in the early 1990s, early 2000s and 2008-10.
|
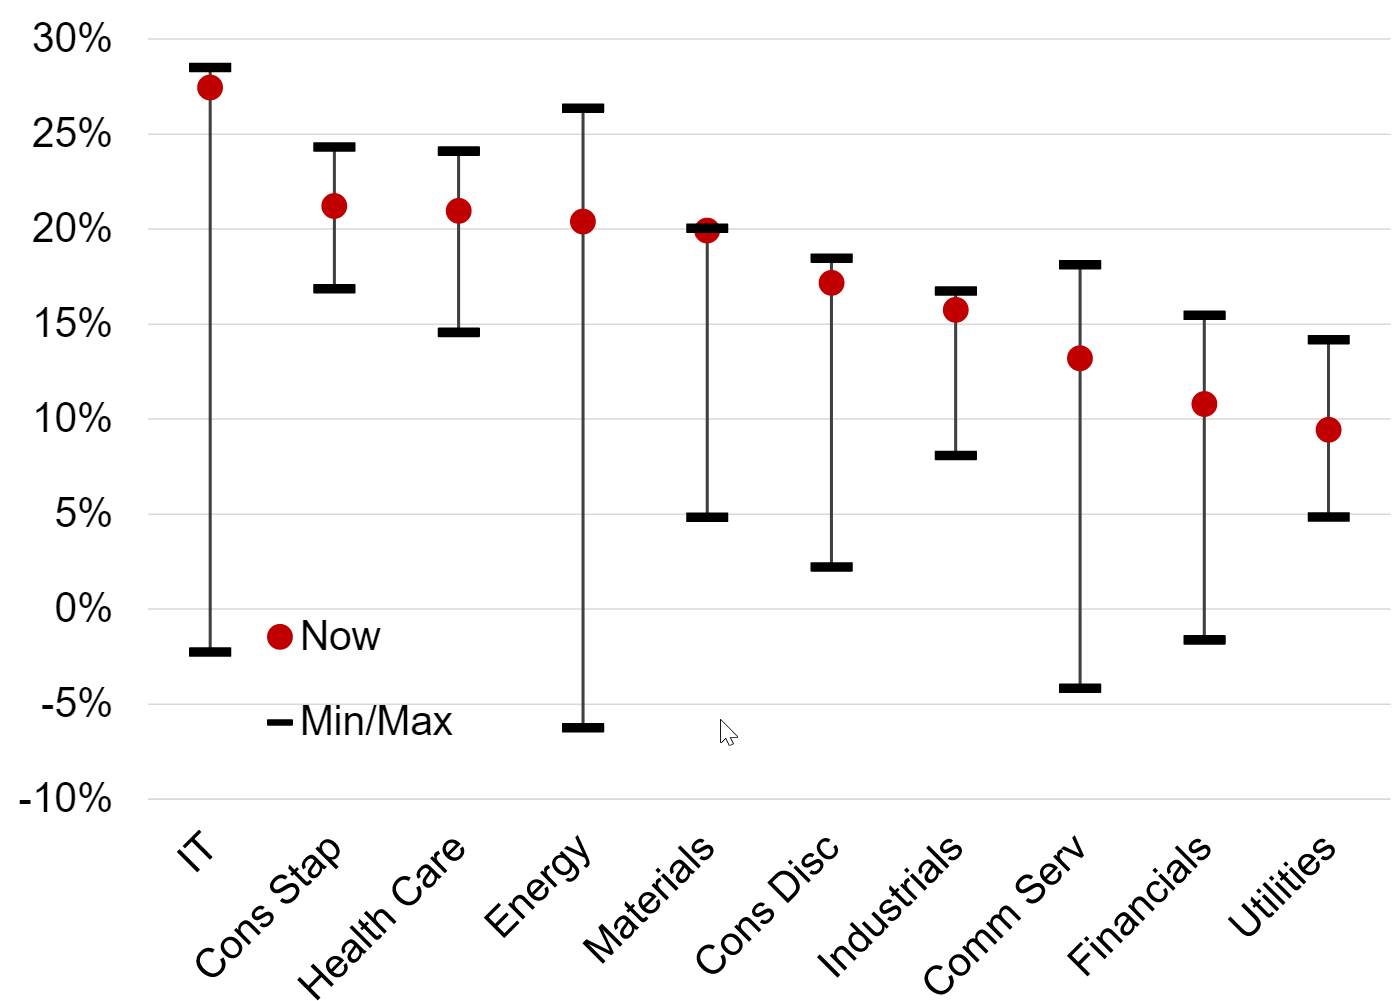
RoE: Now Versus Historic Range (Sectors) |
|
|
|
© 2022 Citigroup Inc. No redistribution without Citigroup’s written permission. |
|
Source: Citi Research, DataStream |
As shown in the chart above, which plots MSCI World sector RoEs against their historic ranges, most sectors are currently enjoying high levels of profitability.
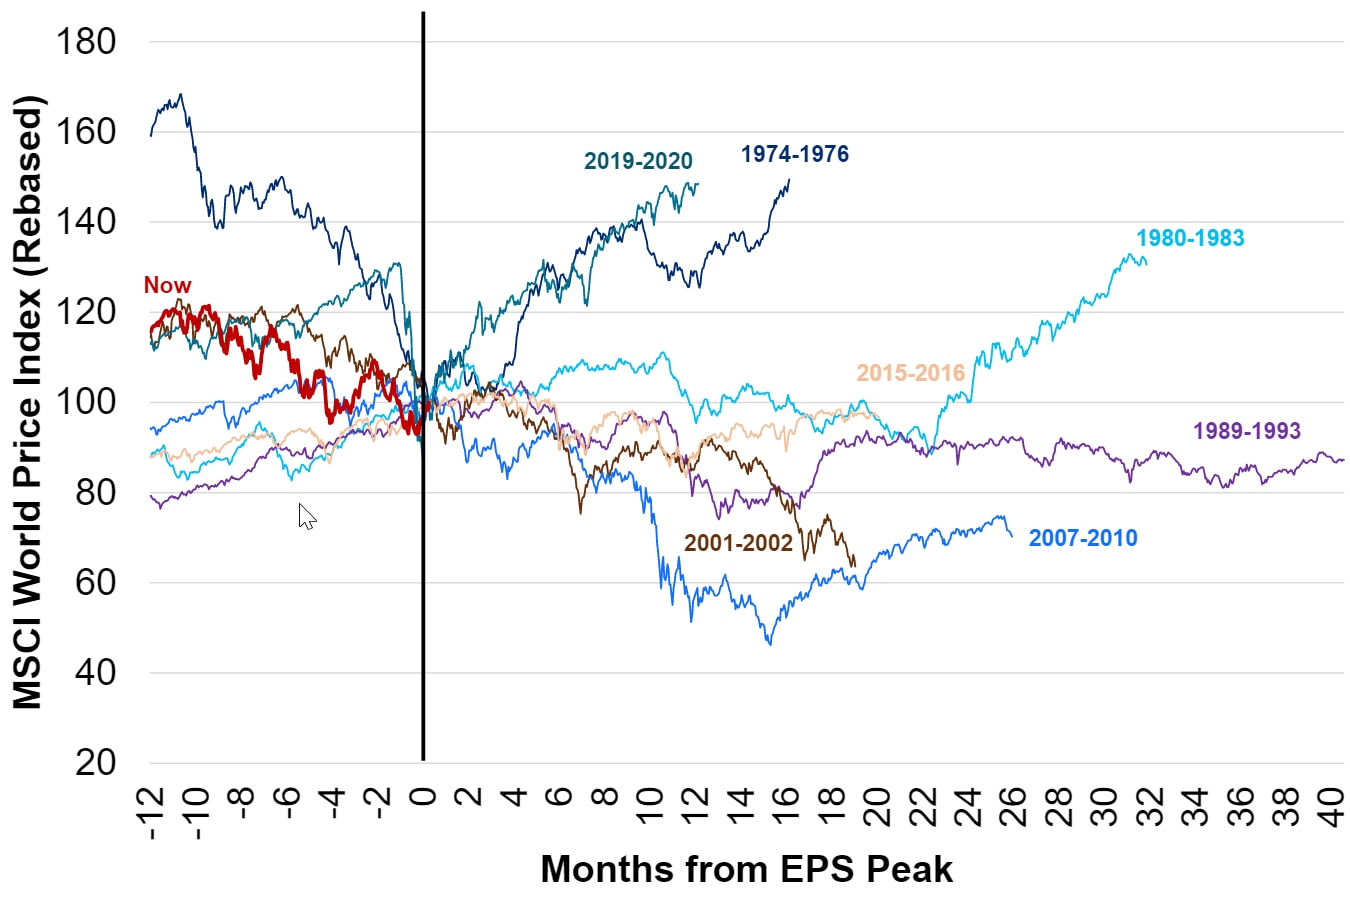
The chart below shows how the MSCI World price index performed before and after previous trailing EPS peaks. On three occasions (1974, 2001, 2020), the market fell sharply 12m before trailing earnings turned down. On two of these (1974, 2020), global equities then actually rose even as earnings fell. In 2001 the market kept falling.
On the other four occasions (1980,1989, 2007, 2015), share prices rose into the earnings peak. However, the MSCI World then dropped an average 27% as EPS turned down.
|
MSCI World Before and During EPS Recessions |
|
|
|
© 2022 Citigroup Inc. No redistribution without Citigroup’s written permission. |
|
Source: Citi Research, DataStream |
For more information on this subject and if you are a Velocity subscriber, please see the full report, which includes a Citi model that can be used to help forecast the potential severity of an EPS recession. Global Equity Strategy - Global EPS Recession
Citi Global Insights (CGI) is Citi’s premier non-independent thought leadership curation. It is not investment research; however, it may contain thematic content previously expressed in an Independent Research report. For the full CGI disclosure, click here.


