
First Quarter 2022 Results and Key Metrics
HIGHLIGHTS
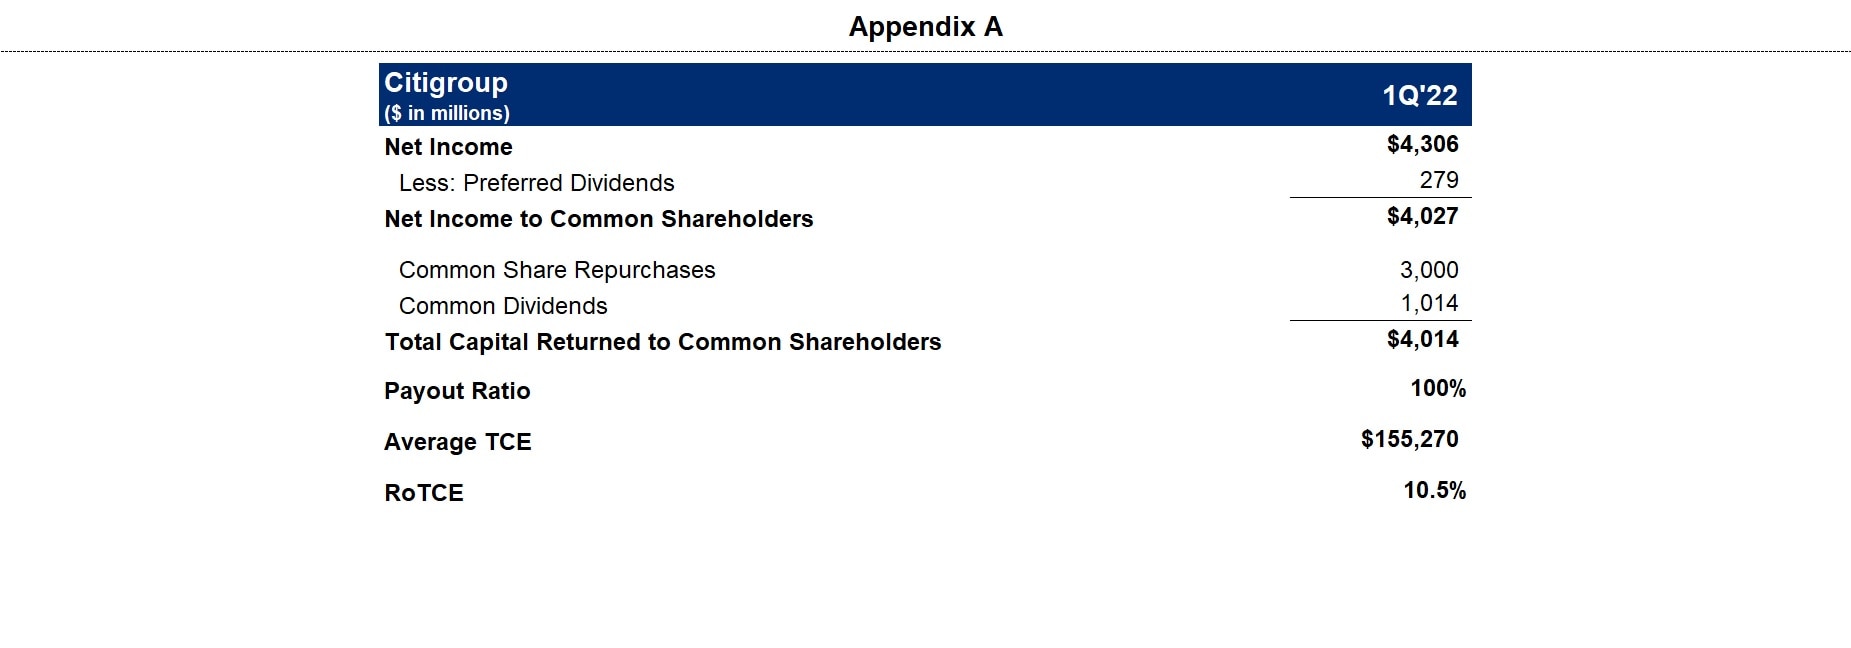
- Returned $4.0 Billion of Capital to Common Shareholders
- Payout Ratio of 100%3
- Book Value per Share of $92.03
- Tangible Book Value per Share of $79.034

Read the full press release with tables and CEO commentary.
View the Financial Supplement (PDF)
View Financial Supplement (Excel)
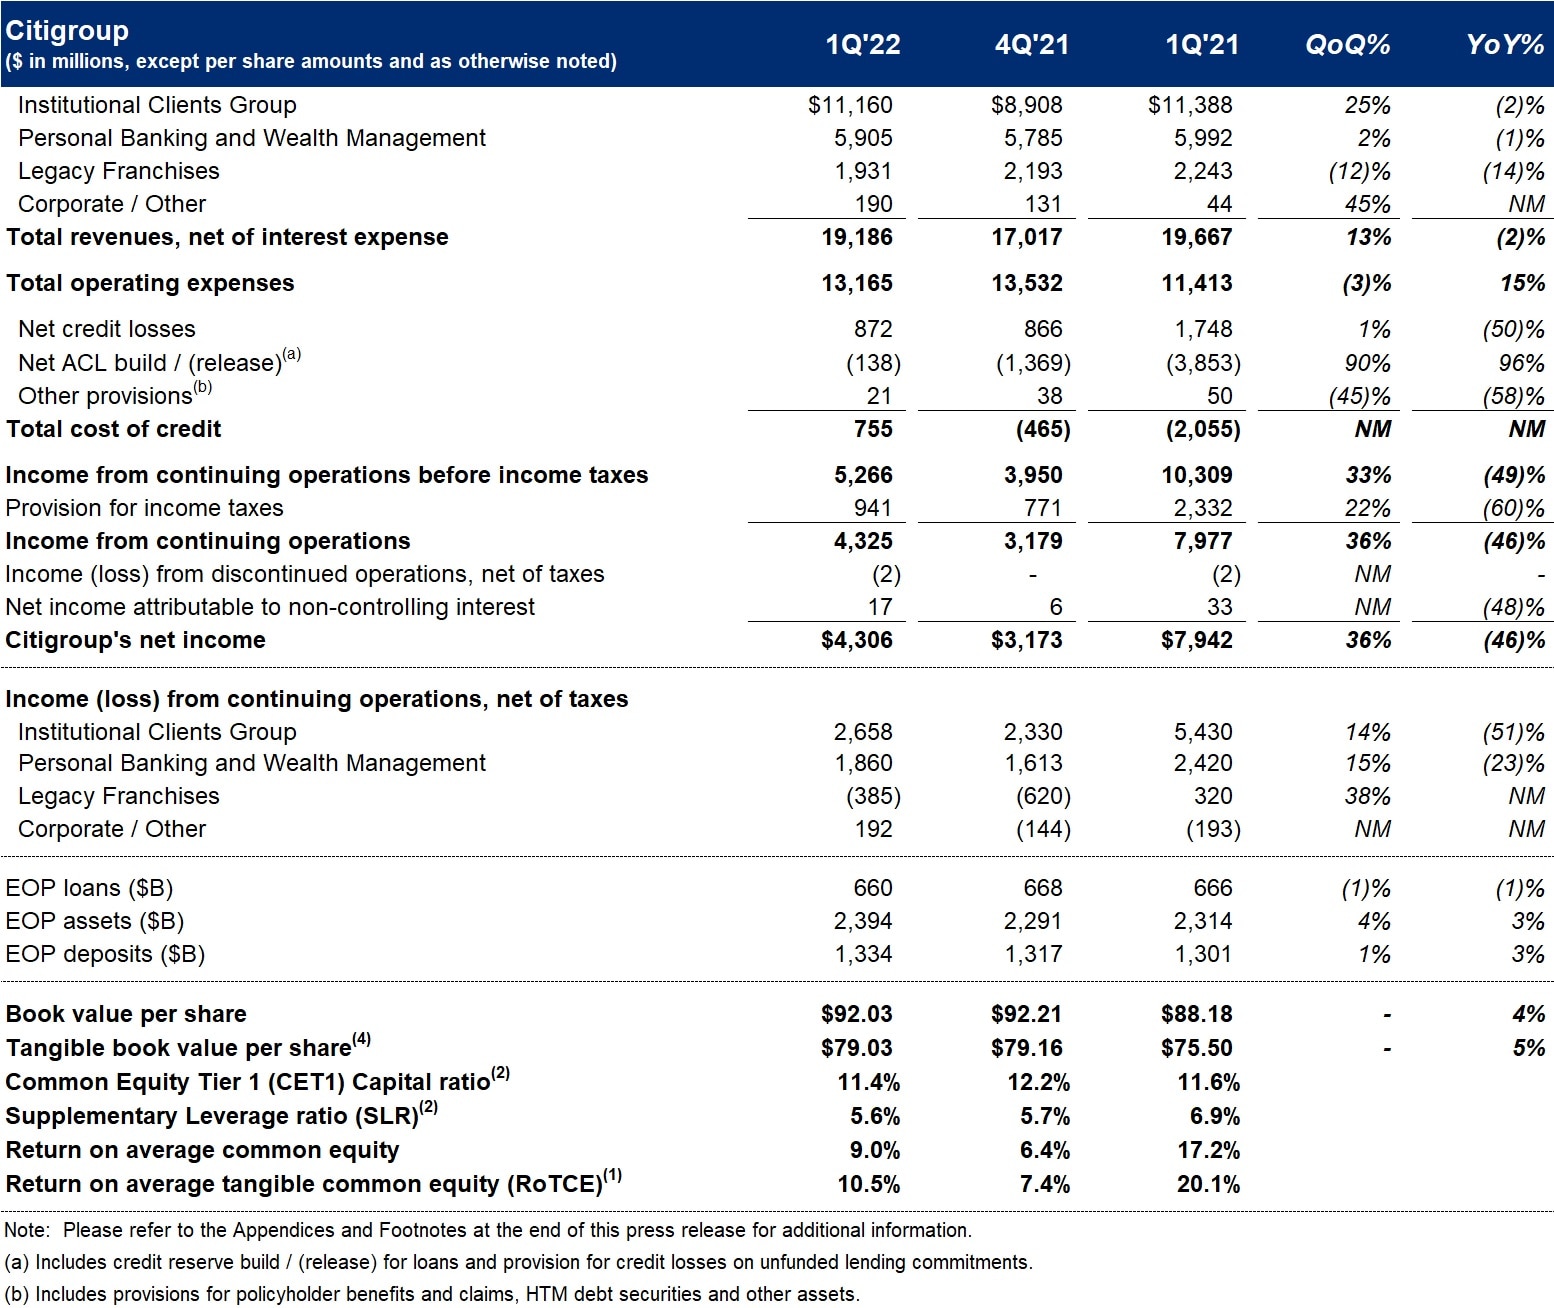
New York – Citigroup Inc. today reported net income for the first quarter 2022 of $4.3 billion, or $2.02 per diluted share, on revenues of $19.2 billion. This compared to net income of $7.9 billion, or $3.62 per diluted share, on revenues of $19.7 billion for the first quarter 2021.
Revenues decreased 2% from the prior-year period, as higher net interest income driven by Services in Institutional Clients Group (ICG) and Personal Banking and Wealth Management (PBWM) was more than offset by lower non-interest revenue across businesses.
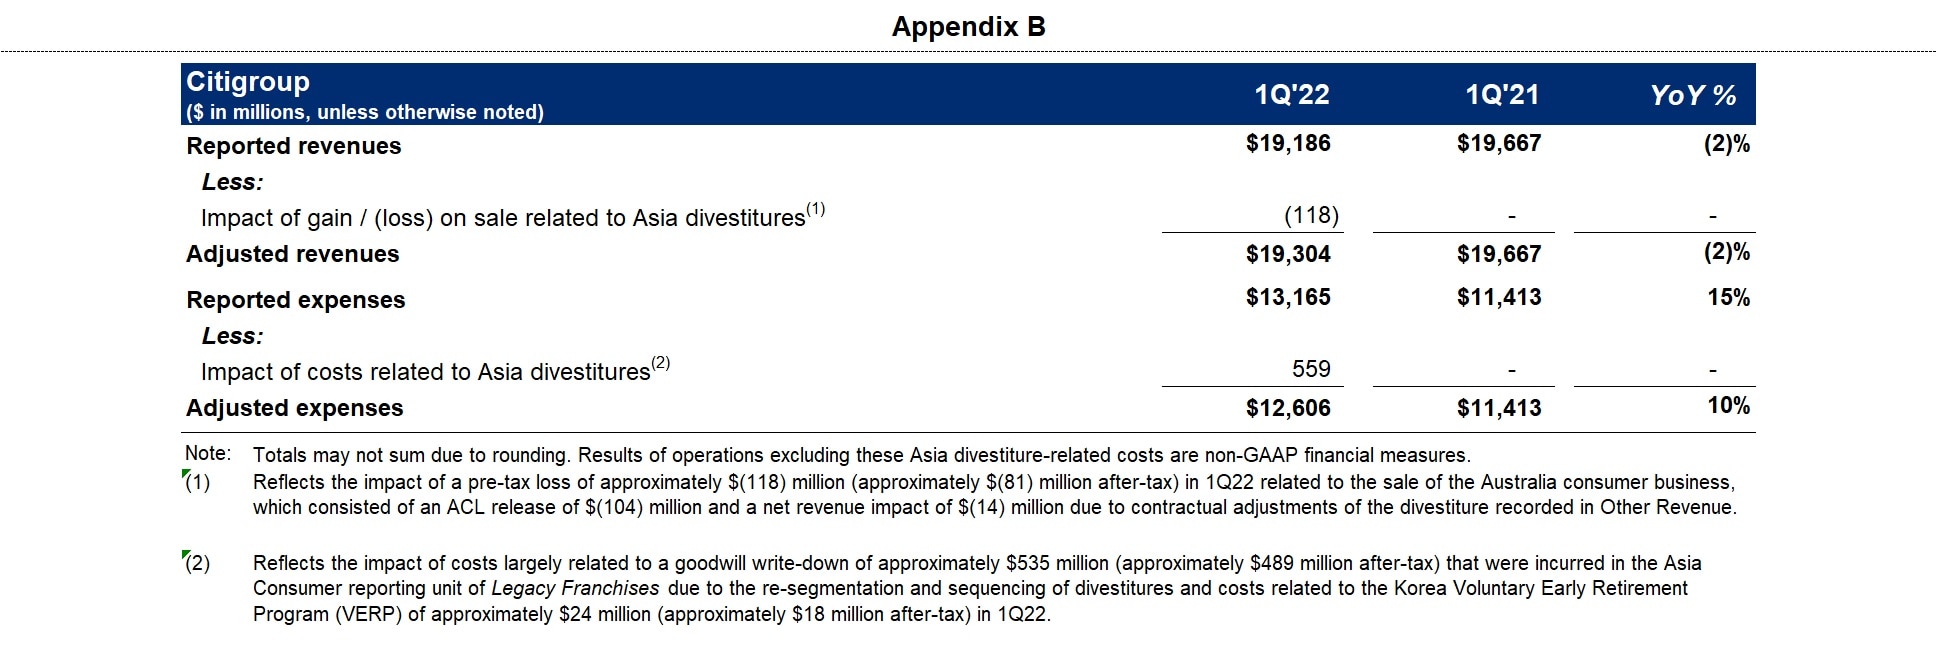
Net income of $4.3 billion decreased 46% from the prior-year period, driven by higher cost of credit, higher expenses, and the lower revenues. Results for the quarter included Asia Consumer divestiture-related impacts of approximately $677 million ($588 million after-tax)5, recorded in Legacy Franchises.
Earnings per share of $2.02 decreased 44% from the prior-year period, reflecting the lower net income, partly offset by a 6% decline in shares outstanding.
Citi CEO Jane Fraser said, "While the geopolitical and macro environment has become more volatile, we are executing the strategy we announced at our recent Investor Day. Given our emphasis on Services, I am particularly pleased with our performance in Treasury and Trade Solutions. Fee growth, trade loans and cross-border transactions — buoyed by higher rates — led to year over year revenue growth of 18%. Securities Services also performed well, with revenue up 6%. In Markets, our traders navigated the environment quite well, aided by our mix, with strong gains in FX and commodities. However, the current macro backdrop impacted Investment Banking as we saw a contraction in capital market activity. This remains a key area of investment for us."
"We continue to see the health and resilience of the U.S. consumer through our cost of credit and their payment rates. We had good engagement in key drivers such as cards loan growth and vigorous purchase sales growth, so we like where this business is headed. While geopolitics dampened performance in Wealth Management, we are hiring bankers, enhancing our client offerings and continuing to add clients in both the Private Bank and in Citigold."
"We returned $4 billion to our shareholders during the first quarter and we now have about 6% fewer common shares outstanding than we did a year ago. While we are making necessary investments in our infrastructure, risk and controls and our businesses, we remain committed to improving our returns over the medium term," Ms. Fraser concluded.
Percentage comparisons throughout this press release are calculated for the first quarter 2022 versus the first quarter 2021, unless otherwise specified.
First Quarter Financial Results
Citigroup
Citigroup revenues of $19.2 billion in the first quarter 2022 decreased 2%, as higher net interest income in Services and PBWM was more than offset by lower non-interest revenue across Banking and Global Wealth Management, as well as lower revenues in Legacy Franchises.
Citigroup operating expenses of $13.2 billion in the first quarter 2022 increased 15%. Excluding the Asia Consumer divestiture-related costs, operating expenses increased 10%, driven by continued investments in Citi's transformation, business-led investments and volume-related expenses, partially offset by productivity savings.
Citigroup cost of credit of $755 million in the first quarter 2022 compared to $(2.1) billion in the prior-year period, as lower net credit losses were more than offset by a lower net release in the allowance for credit losses (ACL). The net release included a $1.9 billion ACL build related to Citi's exposures in Russia and the broader impact of the conflict in Ukraine on the macroeconomic environment.
Citigroup net income of $4.3 billion in the first quarter 2022 decreased 46% from the prior-year period, driven by the higher cost of credit, the higher expenses, and the lower revenues. Citigroup's effective tax rate was 18% in the current quarter versus 23% in the first quarter 2021. The lower tax rate this quarter reflects the resolution of certain tax audit items.
Citigroup's total allowance for credit losses on loans was $15.4 billion at quarter end, with a reserve-to-funded loans ratio of 2.35%, compared to $21.6 billion, or 3.29% of funded loans, at the end of the prior-year period. Total non-accrual assets decreased 34% from the prior-year period to $3.4 billion. Consumer non-accrual loans decreased 36% to $1.5 billion, while corporate non-accrual loans of $1.9 billion decreased 31% from the prior-year period.
Citigroup's end-of-period loans were $660 billion as of quarter end, down 1% versus the prior-year period.
Citigroup's end-of-period deposits were $1.3 trillion as of quarter end, an increase of 3% versus the prior-year period, driven by an 11% increase in PBWM and a 3% increase in ICG.
Citigroup's book value per share of $92.03 and tangible book value per share of $79.03 increased 4% and 5%, respectively, largely driven by accumulated net income and lower shares outstanding. At quarter end, Citigroup's CET1 Capital ratio was 11.4% versus 12.2% in the prior quarter. Citigroup's SLR for the first quarter 2022 was 5.6% versus 5.7% in the prior quarter. During the quarter, Citigroup repurchased approximately 50 million common shares and returned a total of $4.0 billion to common shareholders in the form of repurchases and dividends.
Institutional Clients Group
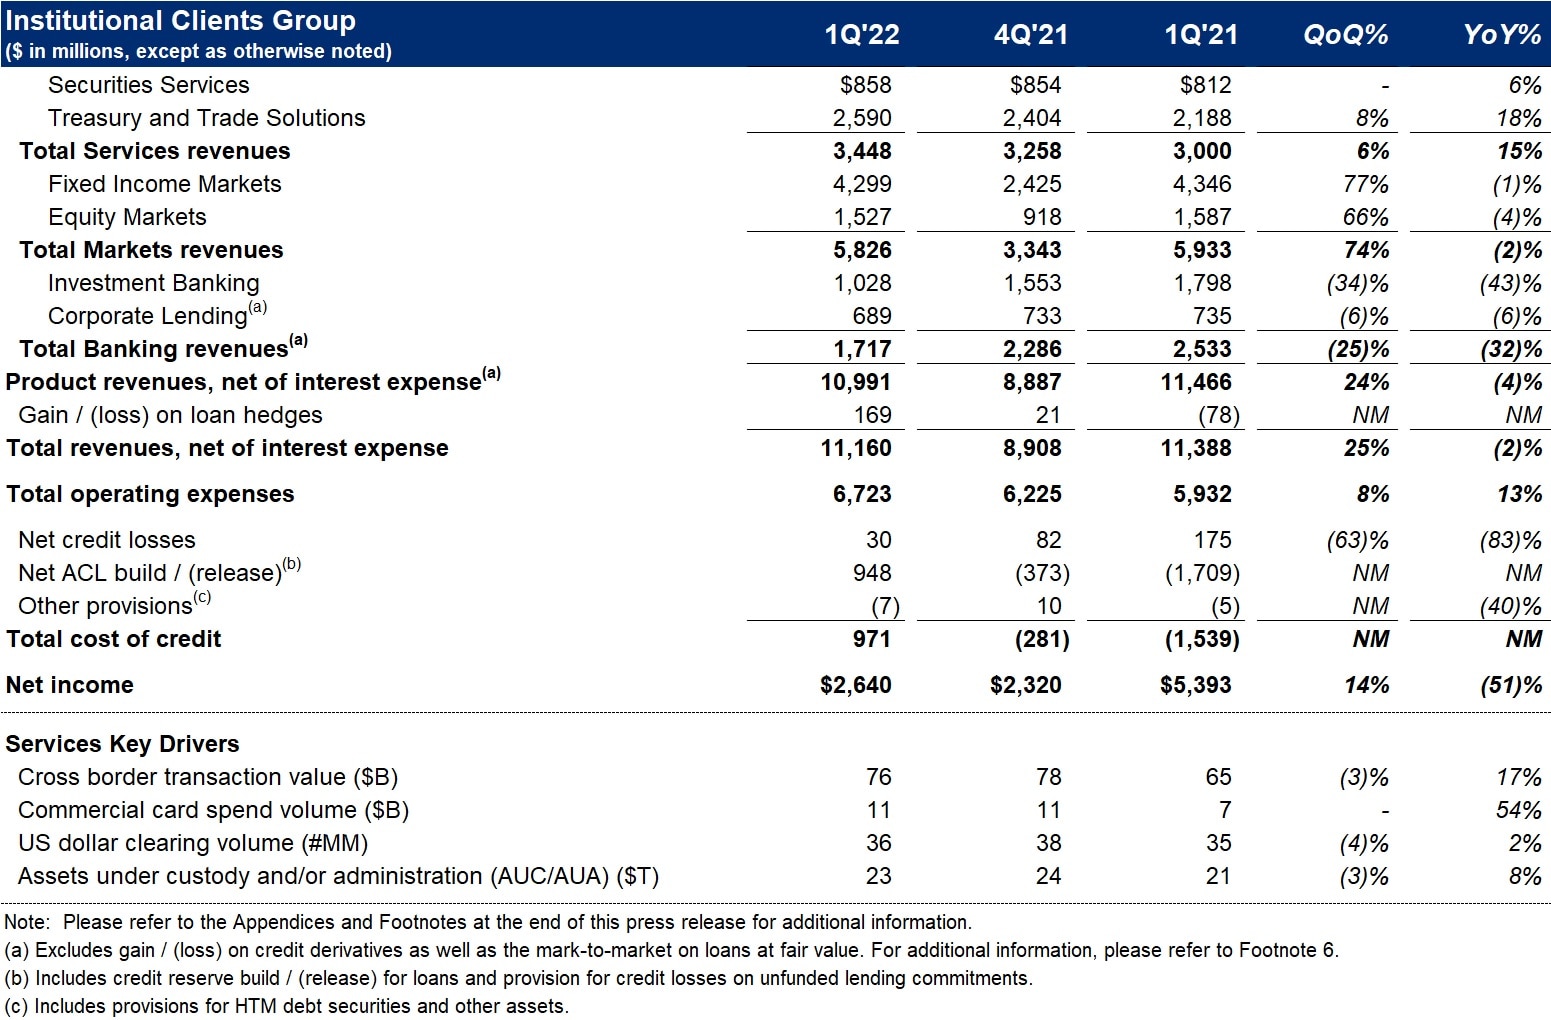
ICG revenues of $11.2 billion decreased 2%, largely driven by Investment Banking, partially offset by an increase in Services revenue.
Services revenues of $3.4 billion increased 15% versus the prior year. Treasury and Trade Solutions revenues of $2.6 billion increased 18%, driven by net interest income on higher deposits balances and spreads as well as strong fee growth. Securities Services revenues of $858 million increased 6%, as net interest income grew 17%, driven by higher interest rates across currencies, and fee revenues grew 2% due to higher assets under custody.
Markets revenues of $5.8 billion were down 2% versus a strong quarter in the prior year. In the quarter, activity levels benefited from client repositioning and strong risk management, driven by the Federal Reserve's interest rate increases and overall geopolitical and macroeconomic uncertainty. Fixed Income Markets revenues of $4.3 billion decreased 1%, as strong client engagement in FX, commodities, and rates was offset by less activity in spread products. Equity Markets revenues of $1.5 billion were down 4% compared to a very strong quarter in the prior year period, reflecting strong equity derivatives performance and growth in prime finance balances.
Banking revenues of $1.7 billion decreased 32% versus the prior year (excluding gain / (loss) on loan hedges)6, as heightened geopolitical uncertainty and the overall macroeconomic backdrop reduced activity in debt and equity capital markets. Investment Banking revenues decreased 43% due to less capital markets activity, partially offset by growth in advisory. Corporate Lending revenues of $689 million decreased 6% (excluding gain / (loss) on loan hedges), primarily driven by lower average loans.
ICG operating expenses of $6.7 billion increased 13%, driven by transformation investments, business-led investments, and volume-related expenses, partially offset by productivity savings.
ICG cost of credit of $971 million compared with $(1.5) billion in the prior-year period, largely driven by a $1.5 billion ACL build related to Citi's exposures in Russia and the broader impact of the conflict in Ukraine on the macroeconomic environment.
ICG net income of $2.6 billion decreased 51% from the prior year, largely driven by the higher expenses and the higher cost of credit.

Personal Banking and Wealth Management
PBWM revenues of $5.9 billion decreased 1% versus the prior year, as higher net interest income was more than offset by lower non-interest revenue.
US Personal Banking revenues of $4.0 billion decreased 1%. Branded Cards revenues of $2.1 billion decreased 1% on higher payment rates and higher acquisition and rewards costs, reflecting increases in new accounts and customer engagement. Retail Services revenues of $1.3 billion were largely unchanged, as higher net interest income was offset by higher partner payments, driven by improved credit performance. Retail Banking revenues of $595 million decreased 6%, largely driven by lower mortgage originations.
Global Wealth Management revenues of $1.9 billion decreased 1%, primarily due to lower client activity in investments, particularly in Asia.
PBWM operating expenses of $3.9 billion increased 14%, driven by transformation and business-led investments, and higher volume-driven expenses, partially offset by productivity savings.
PBWM cost of credit of $(376) million compared to $(557) million in the prior-year period, as lower net credit losses were more than offset by a lower net ACL release.
PBWM net income of $1.9 billion decreased 23%, largely driven by the lower revenues, the higher expenses, and a lower net ACL release.
Legacy Franchises
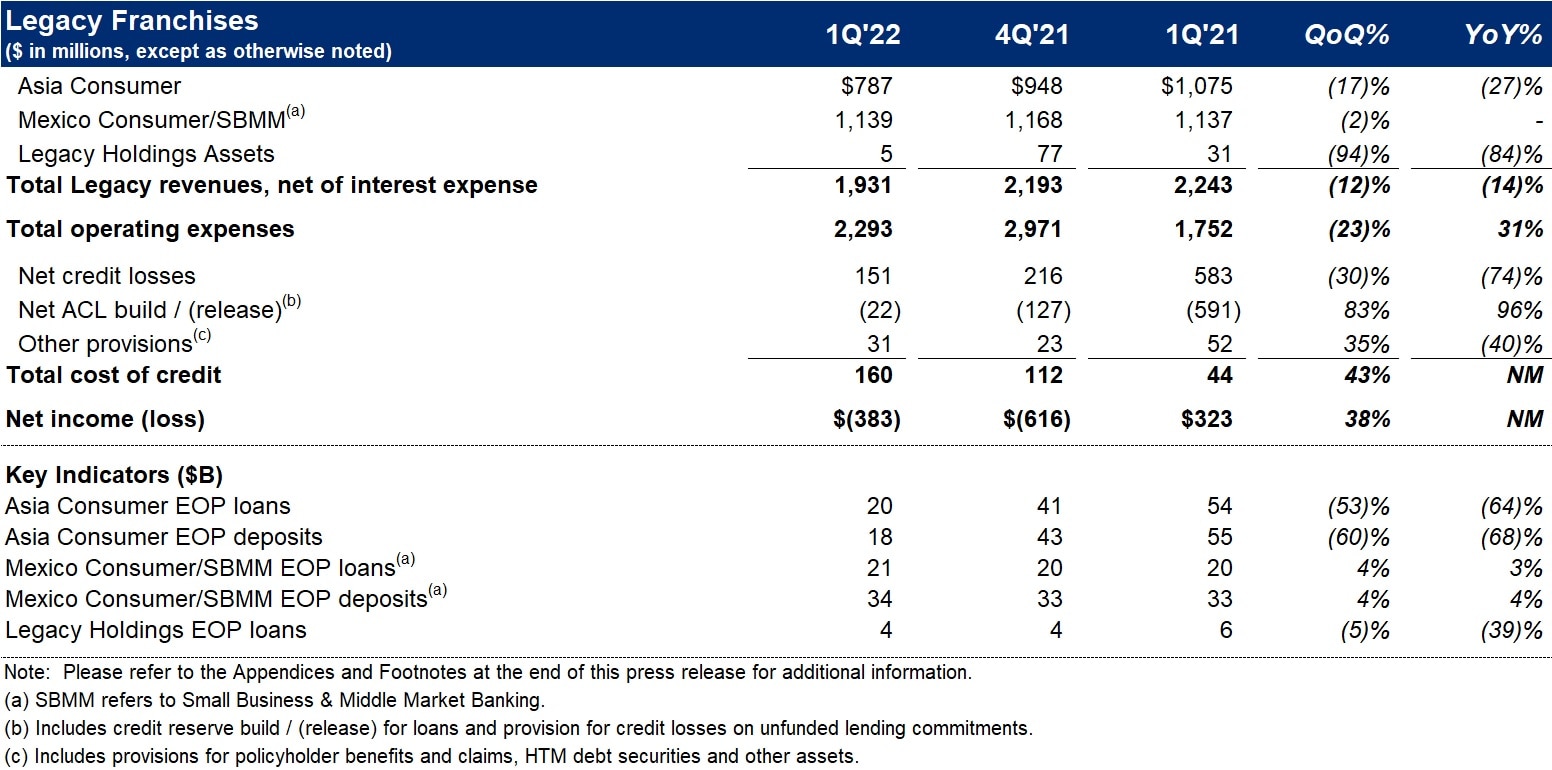
Legacy Franchises revenues of $1.9 billion decreased 14% versus the prior year, largely resulting from the Korea wind down, as well as the muted investment activity in Asia.
Legacy Franchises expenses of $2.3 billion increased 31%, reflecting the Asia Consumer divestiture-related costs.
Legacy Franchises cost of credit of $160 million compared to $44 million in the prior-year period, as lower net credit losses were more than offset by a lower net ACL release.
Legacy Franchises net income of $(383) million compared to $323 million in the prior-year period, reflecting the lower revenues, the higher expenses, and the higher cost of credit.
Corporate / Other
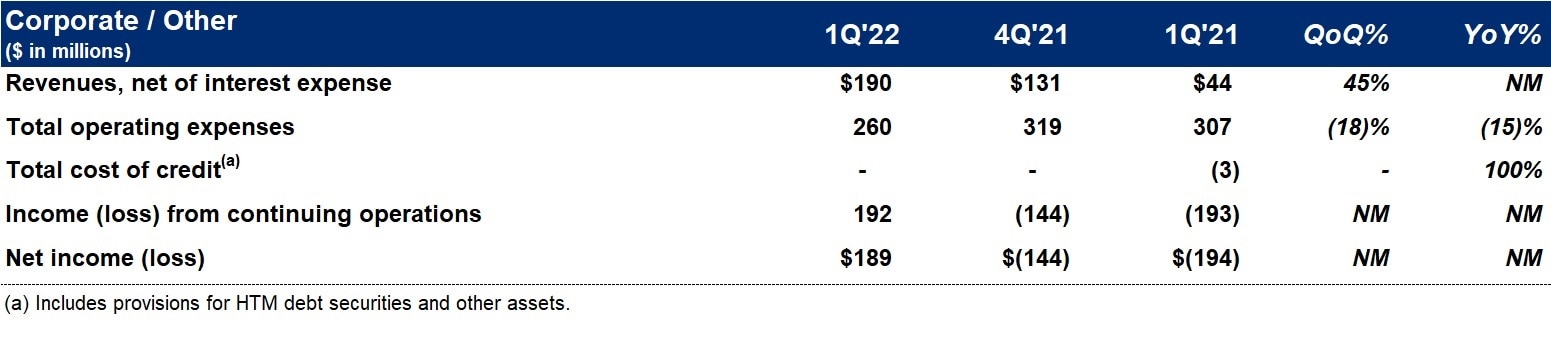
Corporate / Other revenues of $190 million increased significantly, largely driven by higher revenue from the investment portfolio.
Corporate / Other expenses of $260 million decreased 15% versus the prior-year period, largely due to lower compensation costs.
Corporate / Other income from continuing operations of $192 million compared to a loss of $(193) million in the prior-year period, largely driven by the higher revenues and the lower expenses.
Citigroup will host a conference call today at 11 a.m. (ET). A live webcast of the presentation, as well as financial results and presentation materials, will be available at https://www.citigroup.com/global/investors. Dial-in numbers for the conference call are as follows: (866) 516-9582 in the U.S. and Canada; (973) 409-9210 outside of the U.S. and Canada. The conference code for both numbers is 8238026.
Additional financial, statistical and business-related information, as well as business and segment trends, is included in a Quarterly Financial Data Supplement. Both this earnings release and Citigroup's First Quarter 2022 Quarterly Financial Data Supplement are available on Citigroup's website at www.citigroup.com.
Citi
Contacts:


Sign up to receive the latest news from Citi.
