
Fourth Quarter and Full Year 2020 Results and Key Metrics
HIGHLIGHTS
- Net Income of $4.6 Billion ($2.08 per Share)
- Revenues of $16.5 Billion
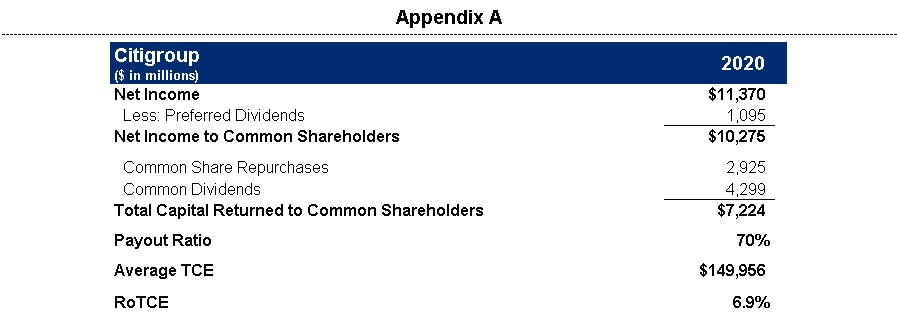
- Returned $1.1 Billion of Capital to Common Shareholders
($7.2 Billion in Full Year 2020) - Book Value per Share of $86.59
- Tangible Book Value per Share of $73.834

Read the full press release with tables and CEO commentary.
View the Financial Supplement (PDF)
View Financial Supplement (Excel)
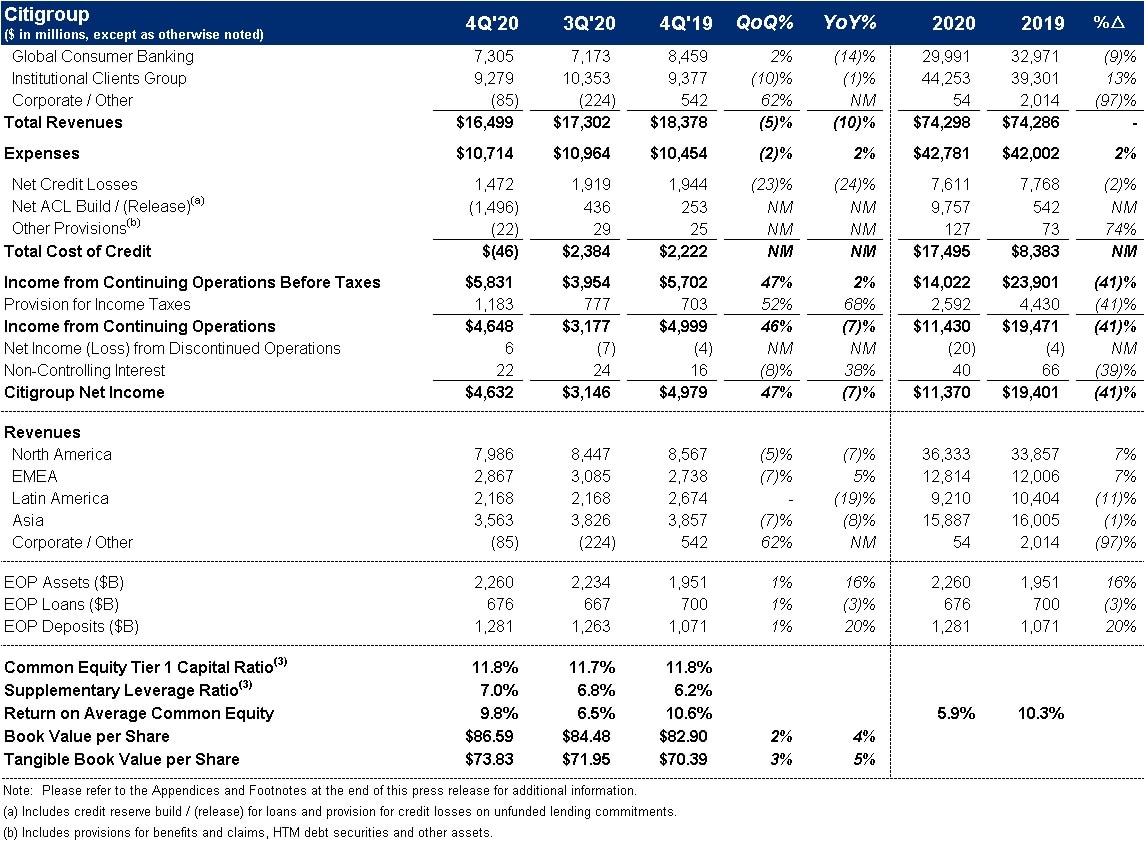
New York – Citigroup Inc. today reported net income for the fourth quarter 2020 of $4.6 billion, or $2.08 per diluted share, on revenues of $16.5 billion. This compared to net income of $5.0 billion, or $2.15 per diluted share, on revenues of $18.4 billion for the fourth quarter 2019.
Revenues decreased 10% from the prior-year period, primarily reflecting lower revenues in Global Consumer Banking (GCB), Institutional Clients Group (ICG), and Corporate / Other. Net income declined 7% from the prior-year period, driven by the lower revenues, an increase in expenses, and a higher effective tax rate, partially offset by the lower cost of credit. Earnings per share of $2.08 decreased 3% from the prior-year period, primarily reflecting the decline in net income.
For the full year 2020, Citigroup reported net income of $11.4 billion on revenues of $74.3 billion, compared to net income of $19.4 billion on revenues of $74.3 billion for the full year 2019.
Michael Corbat, Citi CEO, said, "We ended a tumultuous year with a strong fourth quarter. As a sign of the strength and durability of our diversified franchise, our revenues were flat to 2019, despite the massive economic impact of COVID-19. For the year, we generated $11 billion in net income despite our credit reserves increasing by $10 billion as a result of the pandemic and the impact of CECL.
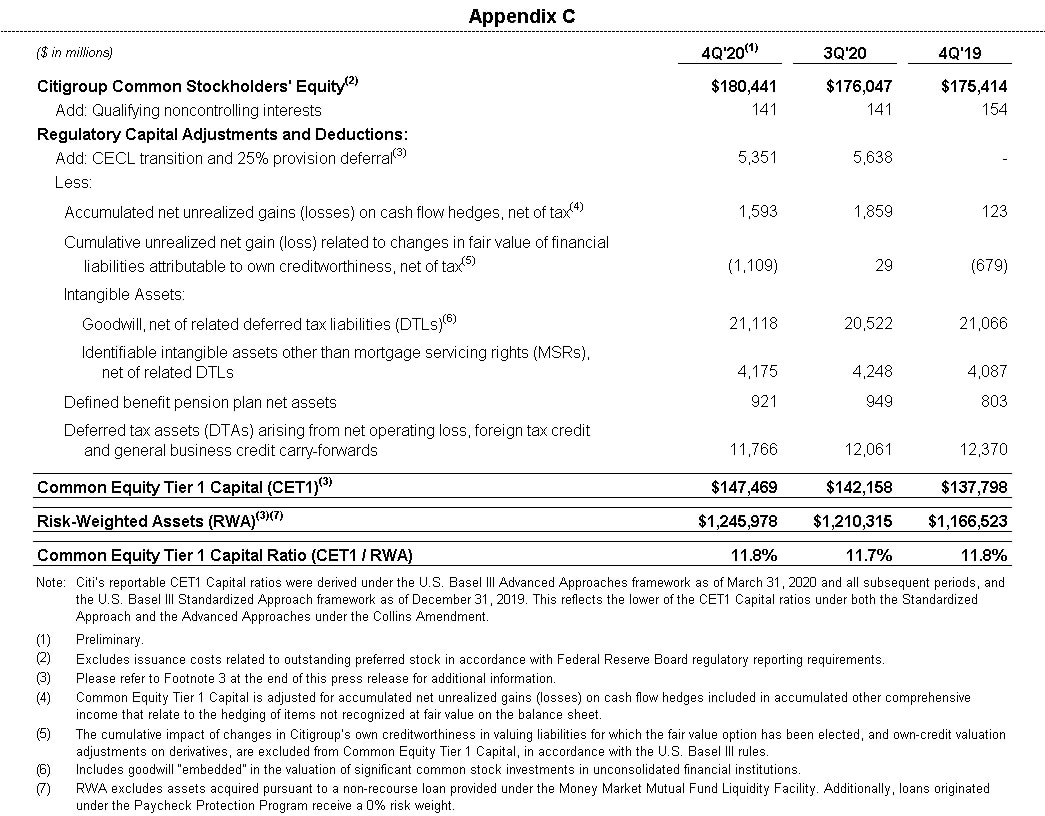
"We remain very well capitalized with robust liquidity to serve our clients. Our CET 1 ratio increased to 11.8%, well above our regulatory minimum of 10%. Our Tangible Book Value per share increased to $73.83, up 5% from a year ago. Given the Federal Reserve decision regarding share repurchases as we have excess capital we can return to shareholders, we plan to resume buybacks during the current quarter.
"Looking back, I am proud of the progress the firm has made since I became CEO. We have streamlined our consumer business and embraced the shift to digital so we can serve our clients the way they want to be served. We have re-established Citi as a go-to bank for our institutional clients through our global network.
"Before the pandemic slowed our progress, we had steadily improved our returns and dramatically increased the return of capital to our shareholders. Notably, we went from having a one penny dividend to returning over $85 billion in capital since 2013 and we have reduced our share-count by 30%. Jane has a great foundation to build upon and I am certain great things are in store for Citi and all its stakeholders," Mr. Corbat concluded.
Percentage comparisons throughout this press release are calculated for the fourth quarter 2020 versus the fourth quarter 2019, unless otherwise specified.
Citigroup
Citigroup revenues of $16.5 billion in the fourth quarter 2020 decreased 10%, primarily reflecting the lower revenues in GCB, ICG, and Corporate / Other.
Citigroup operating expenses of $10.7 billion in the fourth quarter 2020 increased 2%, as continued investments in Citi's transformation, including investments supporting infrastructure, risk management and controls, along with higher repositioning costs more than offset efficiency savings and reductions in discretionary spending.
Citigroup cost of credit of $(46) million in the fourth quarter 2020 compared to $2.2 billion in the prior-year period, largely reflecting a release of allowance for credit loss (ACL) reserves in ICG, driven by improvements in the outlook for global GDP and fewer downgrades in the portfolio, as well as lower net credit losses in GCB.
Citigroup net income of $4.6 billion in the fourth quarter 2020 declined 7%, driven by the lower revenues, the higher expenses, and a higher effective tax rate, partially offset by the lower cost of credit. Citigroup's effective tax rate was 20% in the current quarter compared to 12% in the fourth quarter 2019.
Citigroup's allowance for credit losses on loans was $25.0 billion at quarter end, or 3.73% of total loans, compared to $12.8 billion, or 1.84% of total loans, at the end of the prior-year period. Total non-accrual assets grew 40% from the prior-year period to $5.7 billion. Consumer non-accrual loans increased 18% to $2.1 billion, while corporate non-accrual loans of $3.5 billion increased 61% from the prior-year period.
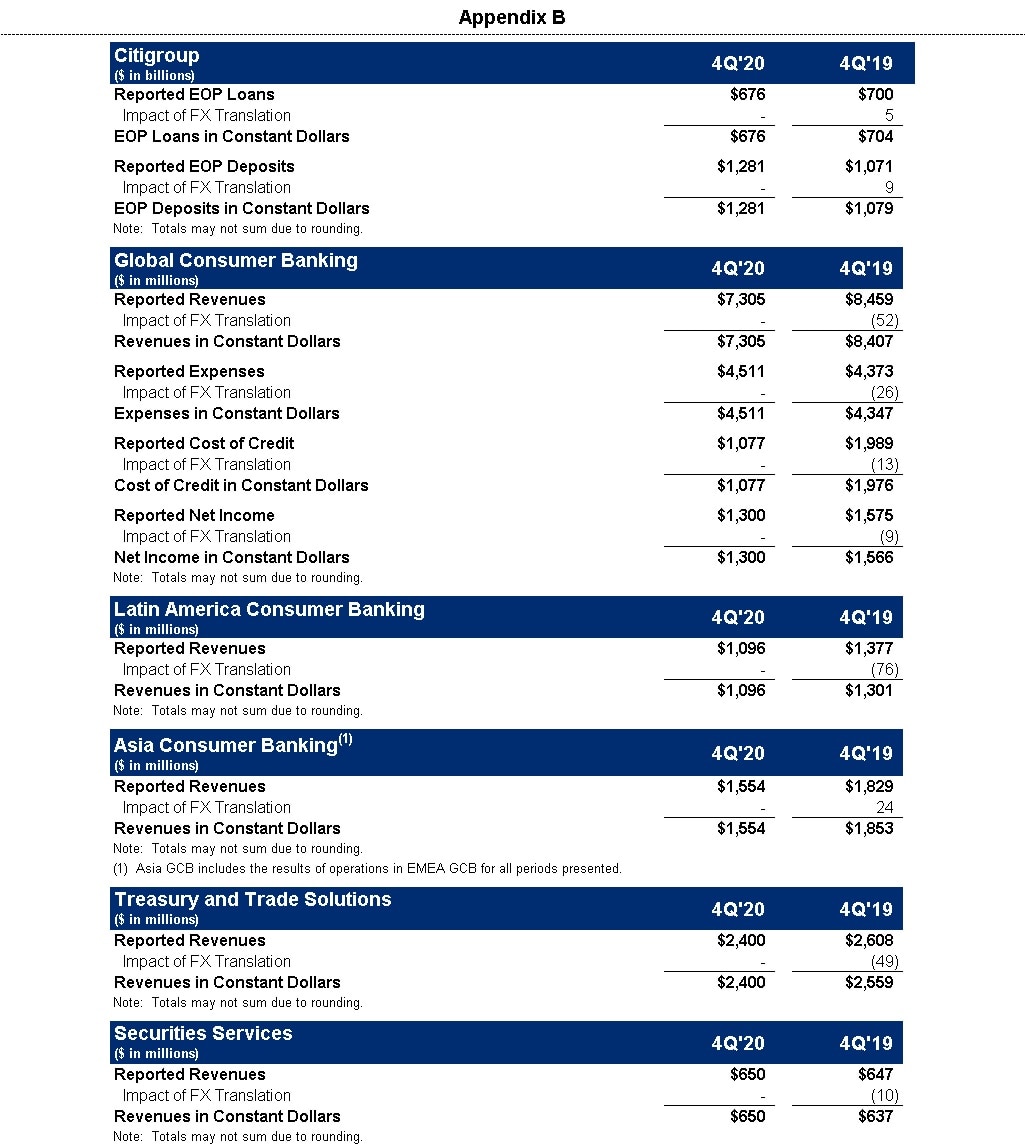
Citigroup's end-of-period loans were $676 billion as of quarter end, down 3% from the prior-year period on a reported basis and 4% excluding the impact of foreign exchange translation5, driven by declines across GCB and ICG, and the continued wind-down of legacy assets in Corporate / Other.
Citigroup's end-of-period deposits were $1.3 trillion as of quarter end, an increase of 20% on a reported basis and 19% in constant dollars, driven by an 18% increase in GCB and a 19% increase in ICG.
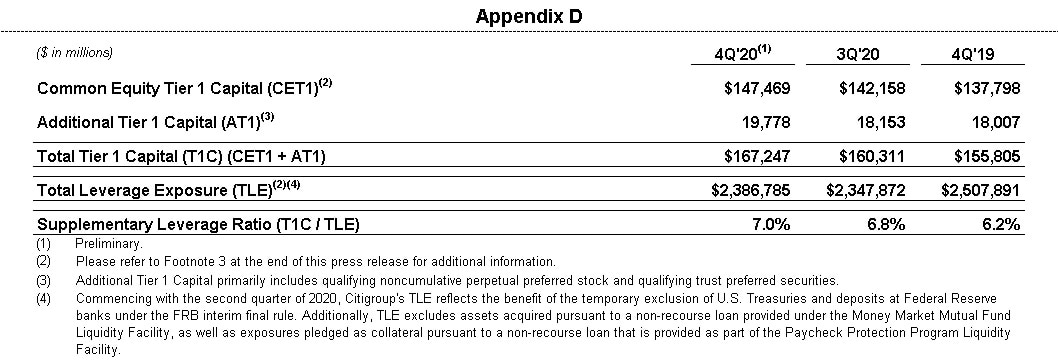
Citigroup's book value per share of $86.59 and tangible book value per share of $73.83 increased 4% and 5%, respectively, largely driven by net income. At quarter end, Citigroup's CET1 Capital ratio was 11.8%, an increase from the prior quarter. Citigroup's SLR for the fourth quarter 2020 was 7.0%, an increase from the prior quarter. During the quarter, Citigroup returned a total of $1.1 billion to common shareholders in the form of dividends.

Global Consumer Banking
GCB revenues of $7.3 billion decreased 14% on a reported basis and 13% in constant dollars, as strong deposit growth and momentum in wealth management were more than offset by lower card volumes and lower interest rates across all regions, reflecting continued impact from the COVID-19 pandemic.
North America GCB revenues of $4.7 billion decreased 11%. Citi-Branded Cards revenues of $2.1 billion decreased 13%, reflecting lower purchase sales and higher payment rates driving lower average loans. Citi Retail Services revenues of $1.4 billion decreased 16%, reflecting lower average loans as well as higher partner payments. Retail Banking revenues of $1.1 billion decreased 1%, as the benefit of stronger deposit volumes and an improvement in mortgage revenues were more than offset by lower deposit spreads.
Latin America GCB revenues of $1.1 billion declined 20% on a reported basis and 16% in constant dollars, driven by lower loan volumes and lower deposit spreads, partially offset by strong deposit growth.
Asia GCB revenues of $1.6 billion declined 15% on a reported basis and 16% in constant dollars, reflecting lower cards revenues, as well as lower deposit spreads, partially offset by strong investments performance and deposit growth.
GCB operating expenses of $4.5 billion increased 3% on a reported basis and 4% in constant dollars, largely driven by higher repositioning costs. Excluding repositioning costs, expenses were largely unchanged, as COVID-19 related expenses were largely offset by efficiency savings.
GCB cost of credit of $1.1 billion decreased 46% on a reported basis and 45% in constant dollars, as lower loan volumes and improved delinquencies led to lower net credit losses, in addition to a net ACL release of $197 million compared to a build in the prior-year period.
GCB net income of $1.3 billion declined 17% from the prior-year period, as reported and in constant dollars, driven by the lower revenues and higher expenses, partially offset by the lower cost of credit.
Institutional Clients Group
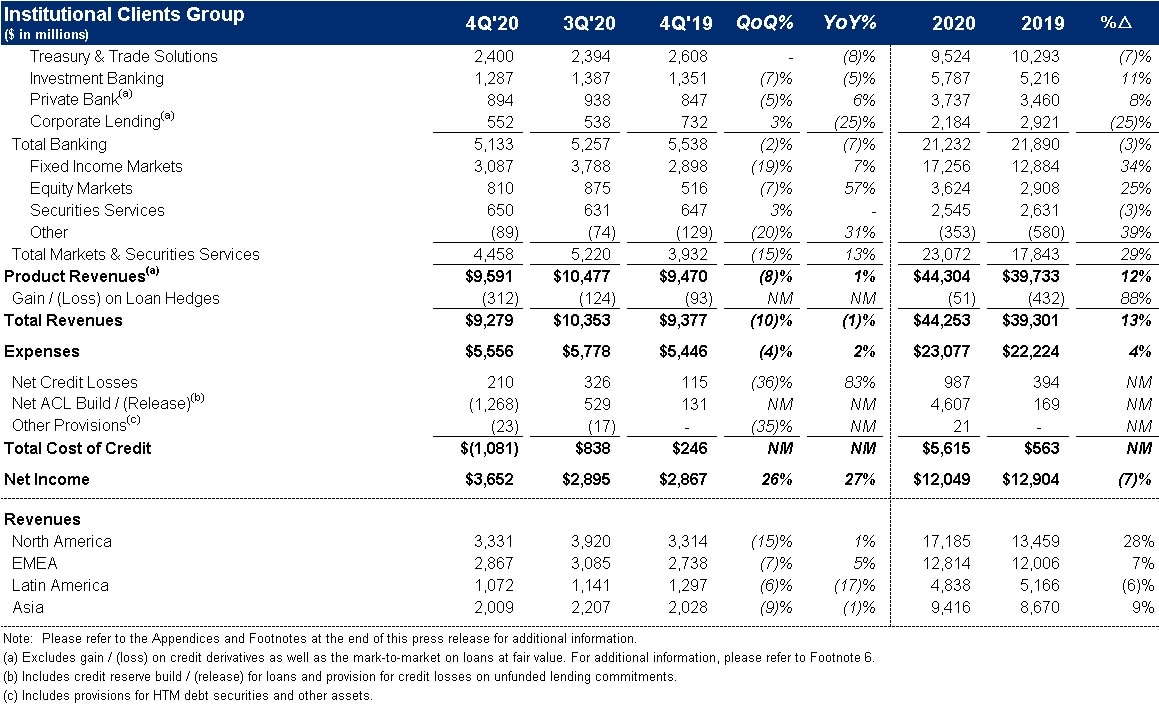
ICG revenues of $9.3 billion decreased 1%, reflecting lower revenues in Treasury and Trade Solutions, Investment Banking, and Corporate Lending, nearly offset by strength in Fixed Income Markets, Equity Markets and the Private Bank.
Banking revenues of $4.8 billion decreased 11% versus the prior year (including gain / (loss) on loan hedges)6. Treasury and Trade Solutions revenues of $2.4 billion declined 8% on a reported basis and 6% in constant dollars, as strong client engagement and growth in deposits were more than offset by the impact of lower interest rates and reduced commercial card spend. Investment Banking revenues of $1.3 billion decreased 5%, as strong growth in equity underwriting was more than offset by lower revenues in M&A and debt underwriting. Advisory revenues decreased 38% to $232 million, while equity underwriting revenues increased 83% to $438 million and debt underwriting revenues declined 16% to $617 million. Private Bank revenues of $894 million increased 6% (excluding gain / (loss) on loan hedges), driven by strong client engagement, particularly in capital markets, as well as improved managed investments revenues and higher lending. Corporate Lending revenues of $552 million declined 25% (excluding gain / (loss) on loan hedges), driven by lower spreads, higher hedging costs and lower average volumes.
Markets and Securities Services revenues of $4.5 billion increased 13%. Fixed Income Markets revenues of $3.1 billion increased 7%, as higher revenues across spread products and commodities were partially offset by lower revenues in rates and currencies. Equity Markets revenues of $810 million increased 57%, driven by strong performance in cash equities, derivatives, and prime finance, reflecting strong client volumes and more favorable market conditions. Securities Services revenues of $650 million were unchanged on a reported basis, but up 2% in constant dollars, as higher deposit and settlement volumes and growth in assets under custody were partially offset by lower spreads.
ICG operating expenses increased 2% to $5.6 billion, primarily driven by continued investments in infrastructure and controls.
ICG cost of credit included net credit losses of $210 million, compared to $115 million in the prior-year period, and a net ACL release of $1.3 billion compared to a build of $131 million in the prior-year period. The net ACL release in the current quarter primarily reflected improvements in the outlook for global GDP, as well as fewer downgrades in the portfolio.
ICG net income of $3.7 billion increased 27%, as the lower cost of credit more than offset the decline in revenues and higher expenses.
Corporate / Other
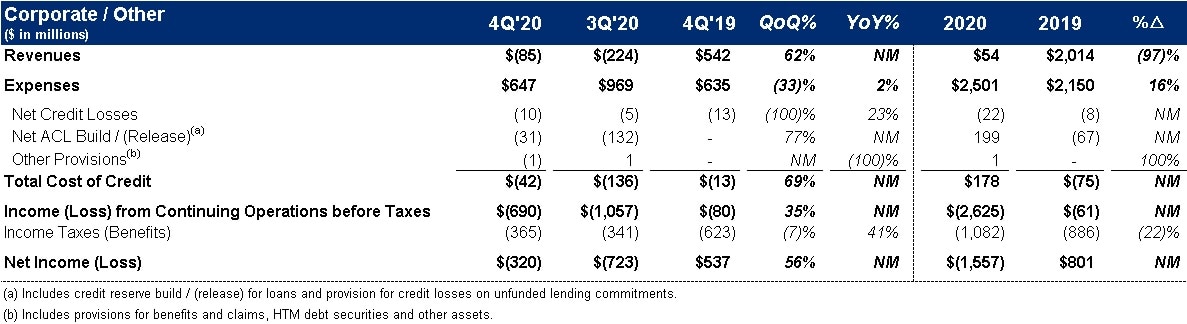
Corporate / Other revenues of $(85) million compared to $542 million in the prior-year period, reflecting the impact of lower rates, the wind-down of legacy assets and the absence of episodic gains.
Corporate / Other expenses of $647 million were up modestly versus the prior-year period, as the wind-down of legacy assets largely offset investments in infrastructure, risk management and controls.
Corporate / Other loss from continuing operations before taxes of $(690) million compared to a loss of $(80) million in the prior-year period, driven by the lower revenues, partially offset by a larger net ACL release on the legacy portfolio.
Citigroup will host a conference call today at 11:30 a.m. (ET). A live webcast of the presentation, as well as financial results and presentation materials, will be available at https://www.citigroup.com/global/investors. Dial-in numbers for the conference call are as follows: (866) 516-9582 in the U.S. and Canada; (973) 409-9210 outside of the U.S. and Canada. The conference code for both numbers is 3686138.
Additional financial, statistical and business-related information, as well as business and segment trends, is included in a Quarterly Financial Data Supplement. Both this earnings release and Citigroup's Fourth Quarter 2020 Quarterly Financial Data Supplement are available on Citigroup's website at www.citigroup.com.
Citi
Contacts:

Sign up to receive the latest news from Citi.
