
Since the outbreak of the pandemic, major countries (China, Japan, Korea, the US) have committed to targets of net zero emissions of greenhouse gasses (GHG) by the middle of the century. This comes against a backdrop of ever-growing interest in ESG investing. According to data from consultancy Opimas, global assets in which ESG data have driven investment decisions are estimated to have almost doubled over four years to US$40.5 trillion in 2020.
While Asia has generally lagged Europe and the US, a 2020 study by National Taipei University reported that 31.7% of the assets of 59 of the largest institutional investors in Taiwan were being managed through at least one type of sustainable investment strategy, larger than the estimated US share in 2018.
Figure 1. Select Regions – Global Sustainable Investment Assets (US$ trillion) |
|
Figure 2. Proportion of Sustainable Investment Relative to Total AUM |
|
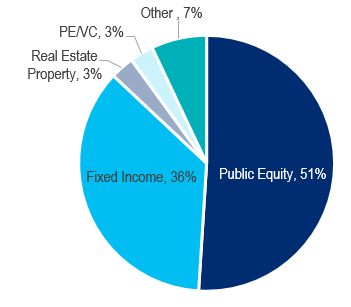
Figure 3. Asset Allocation of Global Sustainable Investment Strategies |
|
|
|
|
|
|
|
Source: GSI-Alliance, Opimas, Citi Research |
|
Source: GSIA – 2018 Sustainability Investment Review, National Taipei University (2020); Note: see footnote 2 |
|
Source: GSIA – 2018 Sustainability Investment Review, Citi Research |


Implications of Greater Scrutiny on the ‘E’ in ESG
Johanna Chua argues that “G” (governance) and “S” (social) issues are already incorporated in sovereign ratings, but that is much less true for “E” (environmental) factors. With companies already scrutinized for their disclosures on green initiatives, assessing a government’s climate change mitigation policies may also increasingly gain prominence. In an earlier analysis, Johanna created a framework for Asia-Pacific to assess a country’s climate risk vulnerability. Parts of South and Southeast Asia ranked very high in ‘physical’ risk (productivity losses, extreme weather, rising sea levels), much less so on ‘mitigation’ risk (the economic burden resulting from a lower-carbon global future).
Figure 4. Greenhouse Gas Emissions per Capita in 2015 |
|
|
|
Source: EDGAR, Haver, Citi Research |

As shown in the figure above, countries in the Asia-Pacific region that emit more GHG per capita than the global average tend to be those that are wealthier – Australia, New Zealand, Japan and Singapore among them. (While the GHG data is for 2015, the relative rankings are unlikely to have changed significantly since.)
GHG Emissions: Getting to the Source of the Problem
Electricity generation is the largest source of global GHG emissions, followed by industrial use and transport. Sectors like land / forestry, and agriculture account for a lot less in aggregate, but their contribution is very high in a few countries – land / forestry in Indonesia (where deforestation and peatland fires are particularly problematic), and agriculture in New Zealand and the Indian subcontinent. New Zealand shows the challenges. More than 82% of its electricity is sourced from renewables, but it ranks as a high emitter on a per-capita basis because of its agriculture, especially livestock (the emissions from which are hard to reduce without reducing the quantity of the livestock).

In her report, Johanna Chua focuses on the prospects (or not) for reducing emissions in electricity/power and in transport, which together account for about 46.5% of global GHG emissions. Climate mitigation technologies are the most mature and increasingly adopted in these two sectors, especially in the shift towards renewables in power and the adoption of electric vehicles in the latter.
- Electricity generation – Coal still accounts for almost 60% of electricity generation in Asia Pacific, especially in the likes of China, India and Indonesia which have abundant domestic coal reserves Climate mitigation in this sector is mostly achieved through switching to gas and renewables. Among higher-income economies, New Zealand is the cleanest given the outsized role of renewables, while Hong Kong and Australia are towards the other end of the spectrum. Among lower per-capita economies, India stands out as having a stable electricity mix, aided by growth in renewables.
- Transportation sector – Korea, Japan, and China are moving relatively quickly toward cleaner and more fuel-efficient transportation, with China leading globally in the adoption of electric vehicles. Among lower-income economies, India seems to be taking the lead, while Vietnam appears to be outpacing ASEAN peers, with Indonesia lagging.
For more information on this subject, please see Asia Economics View: Asia-Pacific’s Climate Mitigation Progress and Prospects.
Citi Global Insights (CGI) is Citi’s premier non-independent thought leadership curation. It is not investment research. The comments expressed herein are summaries and/or views on selected thematic content from a Citi Research report. For the full CGI disclosure, click here.
